Guidelines for computing aggregate statistics
Real-time
verification systems often produce daily verification statistics from
the spatial comparisons of forecasts and observations, and store these
statistics in files. To get aggregate statistics for a period of many
days it is
tempting to simply average all of the daily verification statistics.
Note that
in general this does not give the same statistics as those that would
be
obtained by pooling the samples over many days. For the linear scores
such as
mean error, the same result is obtained, but for non-linear scores (for
example, anything involving a ratio) the results can be quite
different.
For example,
imagine a 30-day time series of the frequency bias score, and suppose
one day had an extremely high bias of 10 because the forecast predicted
an area
with rain but almost none was observed. If the forecast rain area was
20%
every day and this forecast was exactly correct on all of the other 29
days
(i.e., bias=1), the daily mean frequency bias would be 1.30, while the
frequency bias computed by pooling all of the days is only 1.03. These
two values
would lead to quite different conclusions regarding the quality of the
forecast.
The
verification statistics for pooled samples are preferable to averaged
statistics because they are more robust. In most cases they can be
computed
from the statistics for daily forecasts if care is taken. (Note: we
talk about "daily" forecasts and statistics but these guidelines apply
to aggregating verification results from multiple forecasts on any
scale.)
The guidelines below
describe how
to correctly use the daily statistics to
obtain aggregate multi-day
statistics.
An assumption is made that each forecast contains the same number of
samples, N (number of gridpoints or stations).
For pooled categorical
scores computed from the
2x2
contingency table:
First create
an aggregate contingency table of hits, misses, false alarms, and
correction
rejections by summing their daily values, then compute the categorical
scores as usual.
For linear scores (mean
error, mean absolute error MAE,
mean squared error MSE, linear error in probability space
LEPS):
The average of the daily statistics is the same
as the statistics
computed from the
pooled values.
For non-linear scores:
The key is
to transform the score into one for which it is valid to average the
daily values. The mean value is then transformed back into the original
form
of the score.
Root
mean squared error RMSE:
First
square the daily values to obtain the MSE. Average the
squared values, then
take the square root of the mean value.
Root
mean squared factor RMSF:
Take the
logarithm of the daily values and square the result, then average these
values. Transform back to RMSF by taking the
square root and then the exponential.
Variance s2: The
variance
can also be expressed as 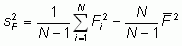 .
To compute the
pooled variance from the
daily variances,
subtract the second term (computed from the daily
.
To compute the
pooled variance from the
daily variances,
subtract the second term (computed from the daily  )
from
)
from  to get
the
daily value of the first term. Average the daily values of the first
term, and use the average of the daily values to compute
the second term. Recombine to get the pooled variance.
to get
the
daily value of the first term. Average the daily values of the first
term, and use the average of the daily values to compute
the second term. Recombine to get the pooled variance.
Standard deviation s: Square the
daily values of s to get daily variances. Compute
the pooled variance as above, then take the square root to get the
pooled
standard deviation.
Correlation
coefficient r:
Multiply
the daily correlations by the daily sF
x sO
to get the covariance, sFO.
The covariance
can be expressed as 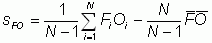 .
Follow the steps given for s2
above to get
a pooled covariance. Divide by the
product of the pooled standard deviations to get the pooled
correlation.
.
Follow the steps given for s2
above to get
a pooled covariance. Divide by the
product of the pooled standard deviations to get the pooled
correlation.
Skill scores: Use
the pooled
values of MAE
or MSE to compute the skill scores.
Back
to Forecast Verification - Issues, Methods and FAQ